Data Watcher
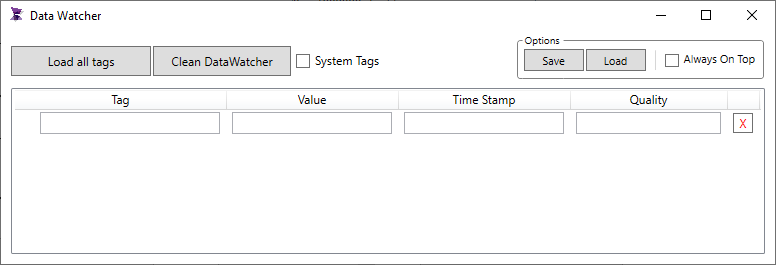
The Data Watcher is a tool that shows the Tags of a project, and let you know its values, allowing you to change them in real time. It can only be used during Runtime. Data Watched can either write the name of the tags on each line within the table, or click the button that reads "Load all tags" to show all tags. A description of each function in the Data Watcher window is below.
. Load all tags button: Show all tags of the project, and some of their properties
. Clean DataWatcher button: Will erase every tag in the table (but it does not erase them from the project
. System Tags checkbox: If checked, it will show the System Tags. It is the best way to know the names and functionality
. Save Button: Saves the Tags visible on the DataWatcher on a .csv file
. Load Button: Loads the tag list from a .csv file
. Always on Top checkbox: If checked, it will display the Data Watcher window above all others
.
 button: Erases the tag of that line

Example for using Data Watcher:
1. Create two Tags integers: NewTag1 and NewTag2.
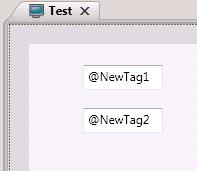
2. Create a Graphic Document and put two TextBoxes in it.
3. In the Text property of the TextBox write: @NewTag1 and @NewTag2, thus, showing the values of the tags.

4. Run the project.
5. While the project is running, the DataWatcher button will activate. Click on it, or use the hot keys: Ctrl + D.
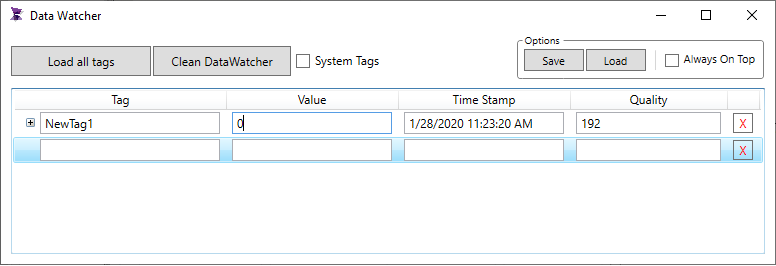
6. The DataWatcher will open empty. Now you can either click on "Load all tags" to see the values of NewTag1 and NewTag2 or write the name of the tag you want to see right into the Tag column and press Enter.

7. Now it is possible to change the value of the tag just by writing a new one on the column "Value". You can verify it changed its value just by looking at the TextBox on the Graphic.