Report Chart
To insert or remove a Chart, use the options located in the Ribbon.
. Insert Chart: Inserts a new Chart
. Remove Chart: Removes a selected Chart

New Chart:
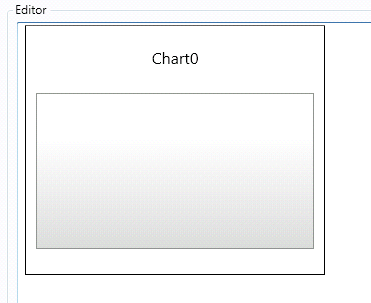
Once a new Chart is created, an empty box will appear, as in the image below, where it is necessary to configure its properties.

Chart Property:
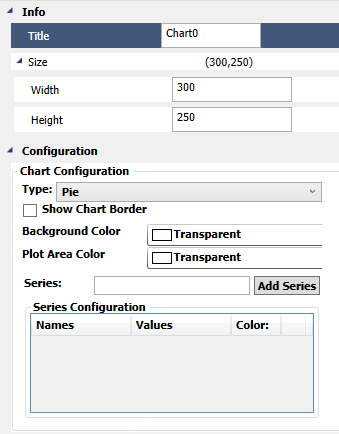
Here it is possible to change the Chart title, set its size, select the type of Chart and configure it.

Info:
. Title: Sets the title of the chart.
Size:
. Width: Sets the Width of the chart.
. Height: Sets the Height of the chart.
Configuration:
. Type: Selects the type of the chart: Bar, Scatter, Pie, Area, Column or Line.
. Serie: Enters a value and legend or a Tag.
. Colors: Selects the colors of the different chart's series.
|
|
|
Note: For more information on charts configuration see Charts. |