Report Editor
The Report Editor allows the user to create the report they want. It can use text, which can be formatted using the Ribbon options, as well as Charts, Tables and Images.
Showing the values of the Tags is easy, just write the @NameOfTheDesiredTag.

. Table
. Charts
. Images
Example:
. In this example we are going to show how to do a report using Tags.
. First, create four tags: @ReportTag1, @ReportTag2, @ReportTag3 and @SaveReport, and configure it as in the picture below:

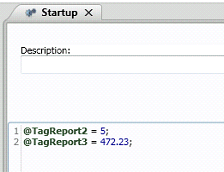
. Now, set them in the Startup Service with some values, for example as below:
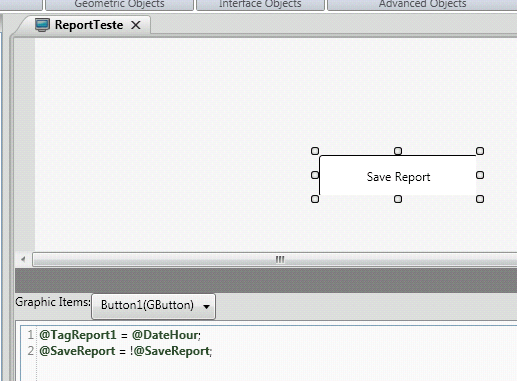
. Next, create a Graphics with a button and configure the MouseUp script as in the next image:
. Now, we are going to create a Report Document.
. Within Report Settings field, set @SaveReport as the Trigger and set Output as "File".
. Choose the path, name and extension desired. In this example, we are creating a Word (.doc) document, with size A4 and Portrait orientation.
. Set Document Status - Enable as TRUE.
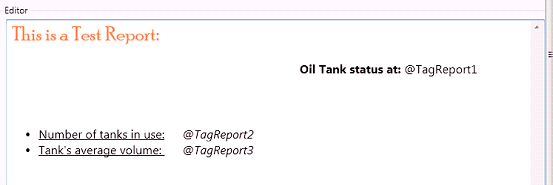
. Within the Editor box, write this:
. Save the project and Run it (F5).
. When running, click on the button we designed to create the report and look for it in the configured path.
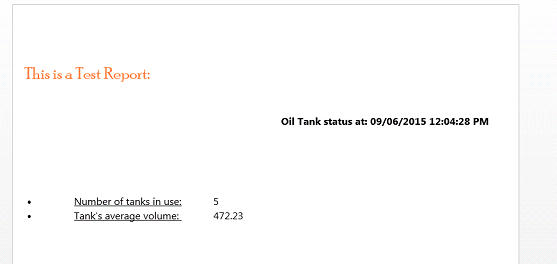
. The result should look like this:
