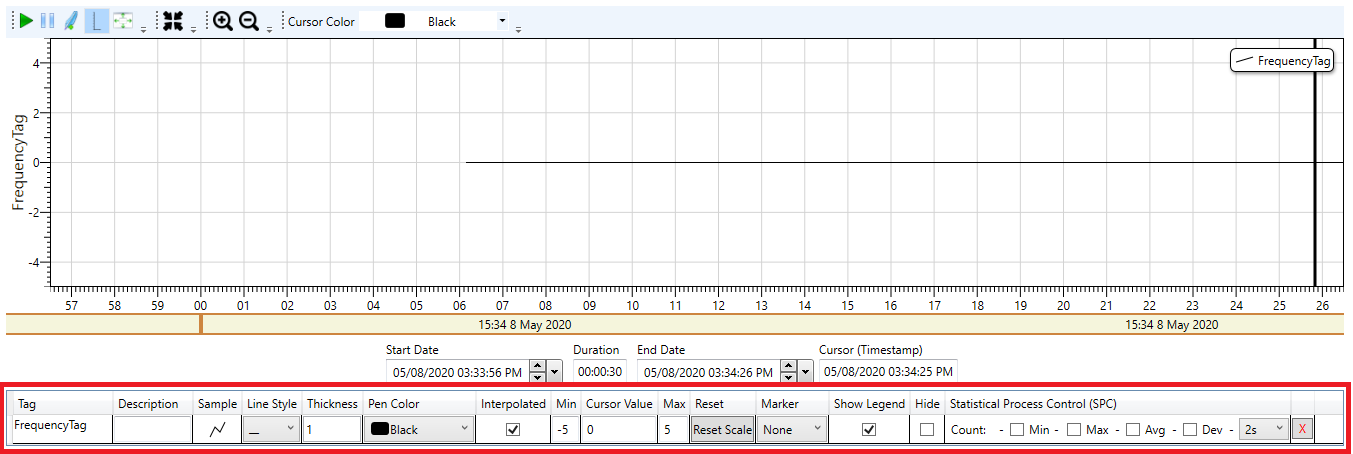
Pen Area
The Pen Area is a table which contains every Pen added into the Trend and its associated information. Here, it is possible to configure and supervise every aspect of a Pen, even delete it, with ease.
Every field of the Pen Area is explained further below:

. Tag: Shows the name of the Tag.
. Description: Shows a description of the Tag.
. Sample: Shows how the pen is represented in the Trend.
. Line Style: Allows changing the style of line to use (Continuous, dashed, dot, dash-dot, etc.).
. Thickness: Allows changing the thickness of the selected pen.
. Pen Color: Allows changing the color of the selected pen.
. Interpolated: Interpolate the values of the pen, making straight lines between points instead of steps.
. Min: Shows the minimum value the Tag has reached.
. Cursor Value: Shows the value where the cursor is pointing.
. Max: Shows the maximum value the Tag has reached.
. Reset: Resets the scale to its original scale.
. Marker: A llows choosing whether to mark the values of the Tag with circles or triangles, making its visualization easier, or leave it unmarked.
. Show Legend: Shows/hides the legend.
. Hide: Shows/hides the Pen line in the trend.
. Statistical Process Control(SPC):
. Count: Indicates how many points the pen has.
. Min: Shows/hides the SPC min line for the pen and indicates the lowest point's value.
. Max: Shows/hides the SPC max line for the pen and indicates the highest point's value.
. Avg: Shows/hides the SPC average line for the pen and indicates the average of the points values.
. Dev: Shows/hides the SPC standard deviation positive e negative lines for the pen and indicates the standard deviation of the pen. There is a combobox to set if it will be one, two or three times the standard deviation
.
 Delete: Deletes the Tag.