Trend Engineering
In this configuration, the user will be able to set the main configuration of the Trend object.
The Trend configuration is made in two steps:
1. Add new pens (tags) in the General Tab.
2. Second, configure them in the Configuration Tab.
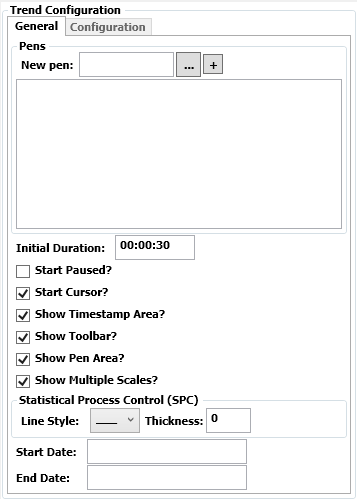
Trend Definitions "General Tab":

. New pen: Field to add new pens (tags).
. Button with the signal "+": Write the tag name and click "+" to add it to the ListBox. You can also press "Enter".
Also, it is possible to establish the Initial Duration (X-axis range), Start Paused, as well as the visualization of the TimeStamp, Toolbar, Pen information Area, and whether to Show Multiple Scales. The user can also now set a Start Date and End Date.
. Initial Duration: This field sets the default time interval to the object. In other words, when using the option "Fit to view" mode of a Trend, the interval displayed will be the value configured in this field.
. Start Paused?: Set if the Trend will start in a paused state.
. Start Cursor?: Set if the Trend will start with the cursor enabled.
. Show Toolbar? : Sets if the Toolbar will be displayed in the object.
The default value is "True" (Visible).
. Show Timestamp Area? : Set if the Timestamp will be displayed in the object.
The default value is "True" (Visible).
. Show Pen Area? : Set if the Pen Area will be displayed in the object.
The default value is "True" (Visible).
. Show Multiple Scales?: Set if multiple scales is desired.
. Start Date/End Date: Enter dates of which to start and end the trend.
Configuration:
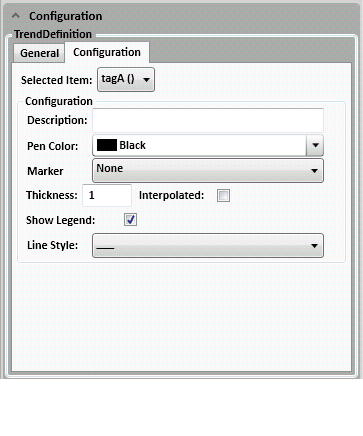
This tab allows the user to configure a Pen, which was already selected on the previous General tab. A brief explanation of the fields that exist in Configuration is following:

. Selected Item: ComboBox to switch between the tags configured.
. Description: Description of the pen.
. Pen Color: Color of the pen line.
. Marker: Type of pen marker.
. Thickness: Pen line thickness.
. Interpolated: If enabled, when a tag value is changed, the line will be drawn straight from the previous value to the new value. If disabled, you will see a step (vertically and horizontally) drawn.
. Show Legend: If enabled, the pen's legend will be shown during Runtime.
. Line Style: Style of the pen line.
Example 1: Adding Trend with one Pen in the Engineering Environment.
. Insert a tag named "tagA" Type Integer in the Tags sheet.
. Create a Graphic screen named Graphic1.
. Insert a TextBox named TextBox1 and in the Properties Window, configure Text field as "@tagA".

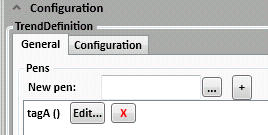
. Insert a Trend object named "trend1". In the Properties Window, go to Trend Definitions and in the General tab, add a new pen named "tagA".

. Configure in the Ribbon the Settings, set the Startup Graphic as Graphic1.

.
Save the project (clicking in the  , or type
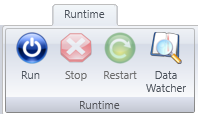
CTRL + S) and Run the Application (F5).

. In the Runtime, alter the value of TextBox and see the results in the Trend.