Matrix Grid
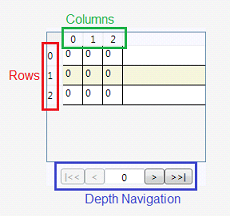
The Matrix Grid is an object created to show the values of one, two or three dimensional Tags with ease. Once inserted the tag, it will insert automatically the values of the Tag.
To create a new Matrix Grid in the Graphics Document:
1. Click the "MatrixGrid" button in the Ribbon.
2. Place the mouse pointer where you want to create the MatrixGrid.
3. Click to create the new MatrixGrid.

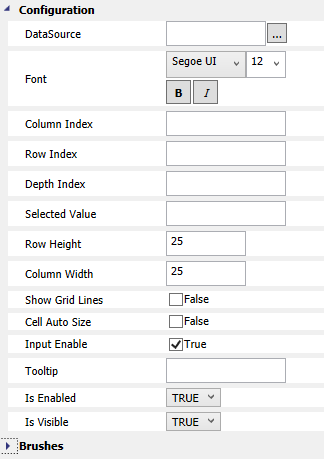
Configuration:


. DataSource: Adds a one or more dimensions Tag to show its values in the Matrix Grid.
. Font: Sets the type of text font.
. Column Index: Establishes the number of columns for the Matrix Grid. It will also display the number of the column of the selected cell.
. Row Index: Establishes the number of rows for the Matrix Grid. It will also display the number of the row of the selected cell.
. Depth Index: Establishes the number of depth for the Matrix Grid. It will also display the number of the depth of the selected cell.
. Selected Value: Displays the value of the selected cell.
. Row Height: Adjusts the row height.
. Column Width: Adjusts the column width.
. Show Grid Lines: Shows/Hides the grid lines separating the cells of the matrix.
. Cell Auto Size: Adjust sthe size to its content automatically.
. Input Enable: Sets the possibility to input a value directly in each cell or not.
. Is Enabled: Sets whether the object will be interactive or not.
. Is Visible: Sets whether the object will be visible or not.
. ToolTip: Writes text to show it as a tooltip of the object.
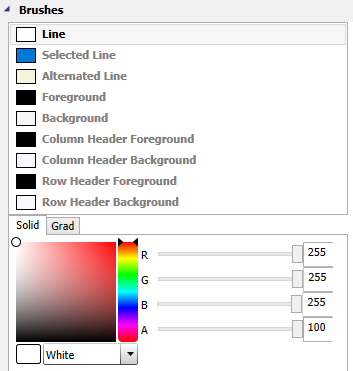
. Background: Changes the color of the background.
. Foreground: Changes the color of the text.
. Column Header Background: Selects the background color of the column header.
. Column Header Foreground: Selects the text color of the column header.
. Row Header Background: Selects the background color of the row header.
. Row Header Foreground: Selects the text color of the row header.
. Line Color: Selects the color of the odd lines.
. Alternated Line Color: Selects the color of the pair lines.
. Selected Line Color: Selects the color of a line when selected.
Example:
We can create a Matrix Grid to show a tag of dimension 3:
1. Create a Tag with dimension 3 and name it "Matrix3Tag" size 3x3x3.
2. Create a Graphic Document.
3. Create a Matrix Grid.
4. Open its Properties Window -> Configuration and add the Tag "Matrix3Tag" into the DataSource TextBox.
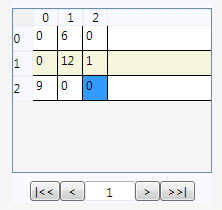
5. Run the program. It will show something like the image below:

6. You can navigate between depth levels using the arrows below the matrix grid.
7. Now, it is possible to assign values to the Tag directly and accurately just by writing in the cells.

Property List:
Info
. Name
. Size
. Location
. ZIndex
Configuration
. Font
. ToolTip
Functions
Brushes
Security